Indices at a Glance
The three indices linked to the Indexed accounts include the S&P 500® Index, the Momentum Index, and the Diversified Macro 5 Index.
These indices offer stable, risk-controlled ways to potentially accumulate value through the indices’ possible growth.
Momentum Index
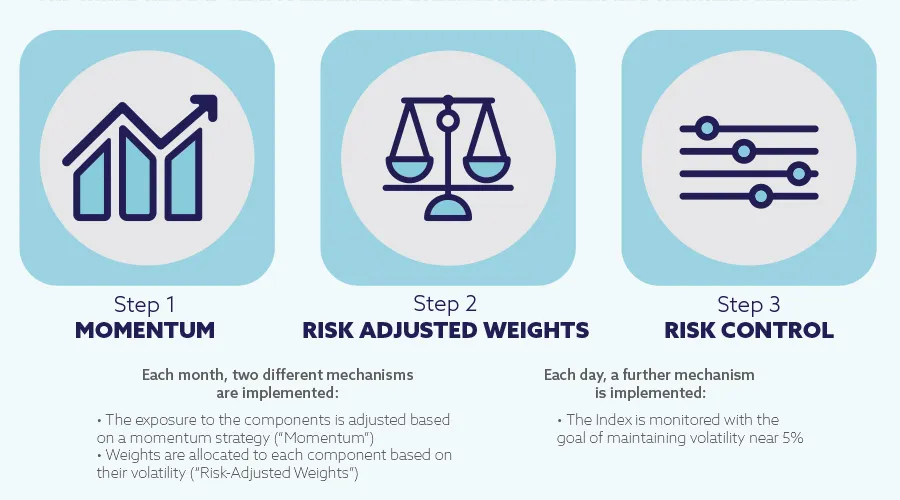
The Momentum Index is a global multi-asset index that dynamically allocates across its components using a unique and flexible momentum-driven strategy with risk-adjusted weightings.
Access to the Momentum Index is exclusive to buyers of the APP annuity.
Diversified Macro 5 Index
The Diversified Macro 5 Index is a fully rules-based index that offers innovative exposure to multiple asset classes. In an attempt to generate consistent returns over time, the Diversified Macro 5 Index implements a strategy that combines an equity component and a macro component (comprised of sub-strategies across fixed income, commodities and currencies components), complemented by a daily risk control mechanism.
Access to the Diversified Macro 5 Index is exclusive to buyers of the APP annuity.
S&P 500® Index
The S&P 500® Index measures the stock performance of the 500 largest publicly-traded companies in the U.S. These companies represent the leading industries of the U.S. economy.
Momentum Index
The Momentum Index is a global multi-asset index that dynamically allocates across its components using a unique and flexible momentum-driven strategy with risk-adjusted weightings. The Momentum Index was designed to adapt to various market conditions and generate consistent returns over time.
The risk-monitored Momentum Index can create value for your annuity in all market types (rising, falling, or remaining the same) by taking long positions (buying) in components exhibiting the strongest trends and short positions (selling) in components with weaker trends.
Access to the Momentum Index is exclusive to buyers of the Accumulation Protector PlusSM Annuity.
The Index Has a 3-Step Rebalancing Process Built Upon Key Financial Concepts
Diversified Macro 5 Index
The Diversified Macro 5 Index is a fully rules-based index that offers innovative exposure to multiple asset classes. In an attempt to generate consistent returns over time, the Diversified Macro 5 Index implements a strategy that combines an equity component and a macro component (comprised of sub-strategies across fixed income, commodities and currencies components), complemented by a daily risk control mechanism.
Access to the Diversified Macro 5 Index is exclusive to buyers of the Accumulation Protector PlusSM Annuity.
The S&P 500® Index
The S&P 500® Index measures the stock performance of the 500 largest publicly-traded companies in the U.S. These companies represent the leading industries of the U.S. economy.
Product Sites
Quick Links
For Atlantic Coast Life Insurance Company-Licensed Agent Use Only.
All product recommendations must be prioritized by the consumer’s best interest.
This website is intended only for the person or entity to which it is addressed and may contain confidential and/or privileged material. Please be aware that any unauthorized review; copying, use, disclosure or distribution of this information is prohibited.
The “S&P 500®” is a product of S&P Dow Jones Indices LLC or its affiliates (“SPDJI”), and has been licensed for use by Atlantic Coast Life Insurance Company. Standard & Poor’s® and S&P® are registered trademarks of Standard & Poor’s Financial Services LLC (“S&P”); Dow Jones® is a registered trademark of Dow Jones Trademark Holdings LLC (“Dow Jones”); and these trademarks have been licensed for use by SPDJI and sublicensed for certain purposes by Atlantic Coast Life Insurance Company. Accumulation Protector PlusSM Annuity is not sponsored, endorsed, sold or promoted by SPDJI, Dow Jones, S&P®, or their respective affiliates, and none of such parties make any representation regarding the advisability of investing in such product(s) nor do they have any liability for any errors, omissions, or interruptions of the S&P 500®.
The Momentum Index and Diversified Macro 5 Index are volatility-controlled indexes that may include a fee in the computation of the index value.
Neither MerQube, Inc. nor any of its affiliates (collectively, “MerQube”) is the issuer or producer of Accumulation Protector PlusSM Annuity and MerQube has no duties, responsibilities, or obligations to investors in Accumulation Protector PlusSM Annuity. The index underlying the Accumulation Protector PlusSM Annuity is a product of MerQube and has been licensed for use by Atlantic Coast Life Insurance Company. Such index is calculated using, among other things, market data or other information (“Input Data”) from one or more sources (each a “Data Provider”). MerQube® is a registered trademark of MerQube, Inc. These trademarks have been licensed for certain purposes by Atlantic Coast Life Insurance Company in its capacity as the issuer of the Accumulation Protector PlusSM Annuity. Accumulation Protector PlusSM Annuity is not sponsored, endorsed, sold or promoted by MerQube, any Data Provider, or any other third party, and none of such parties make any representation regarding the advisability of investing in such product(s) nor do they have any liability for any errors, omissions, or interruptions of the Input Data, Diversified Macro 5 Index or any associated data.
The Momentum Index, (the “Index”), and any trademarks, service marks and logos related thereto are service marks of Solactive AG (“Solactive”). Solactive has no relationship to Atlantic Coast Life Insurance Company, other than the licensing of the Momentum Index and its service marks for use in connection with the Accumulation Protector PlusSM Annuity and is not a party to any transaction contemplated hereby. The Accumulation Protector PlusSM Annuity is not sponsored, endorsed, or promoted by Solactive in any way and Solactive makes no express or implied representation, guarantee or assurance regarding the quality, accuracy and/or completeness of the Index, and the results obtained or to be obtained by any person or entity from the use of the Index. Solactive reserves the right to change the methods of calculation or publication with respect to the Index. Solactive shall not be liable for any damages suffered or incurred because of the use (or inability to use) of the Index. Solactive shall not be liable for the results obtained by using, investing in, or trading the Accumulation Protector PlusSM Annuity. Solactive has not created, published, or approved this document and accepts no responsibility or liability for its contents or use. Obligations to make payments under the Accumulation Protector PlusSM Annuity are solely the obligation of Atlantic Coast Life Insurance Company and are not the responsibility of Solactive.
For Atlantic Coast Life-Licensed Agents Only